
Introduction
In today's competitive business environment, data has become one of the most valuable assets for any organization. However, raw data alone has little value unless it can be transformed into meaningful insights. Business Intelligence (BI) dashboards help organizations collect, analyze, and visualize data in an interactive format, enabling decision-makers to monitor business performance and make informed strategic decisions.
A modern BI dashboard provides a centralized view of sales, customer behavior, operational performance, and financial metrics, allowing businesses to quickly identify trends, opportunities, and potential risks.
What is a Business Intelligence Dashboard?
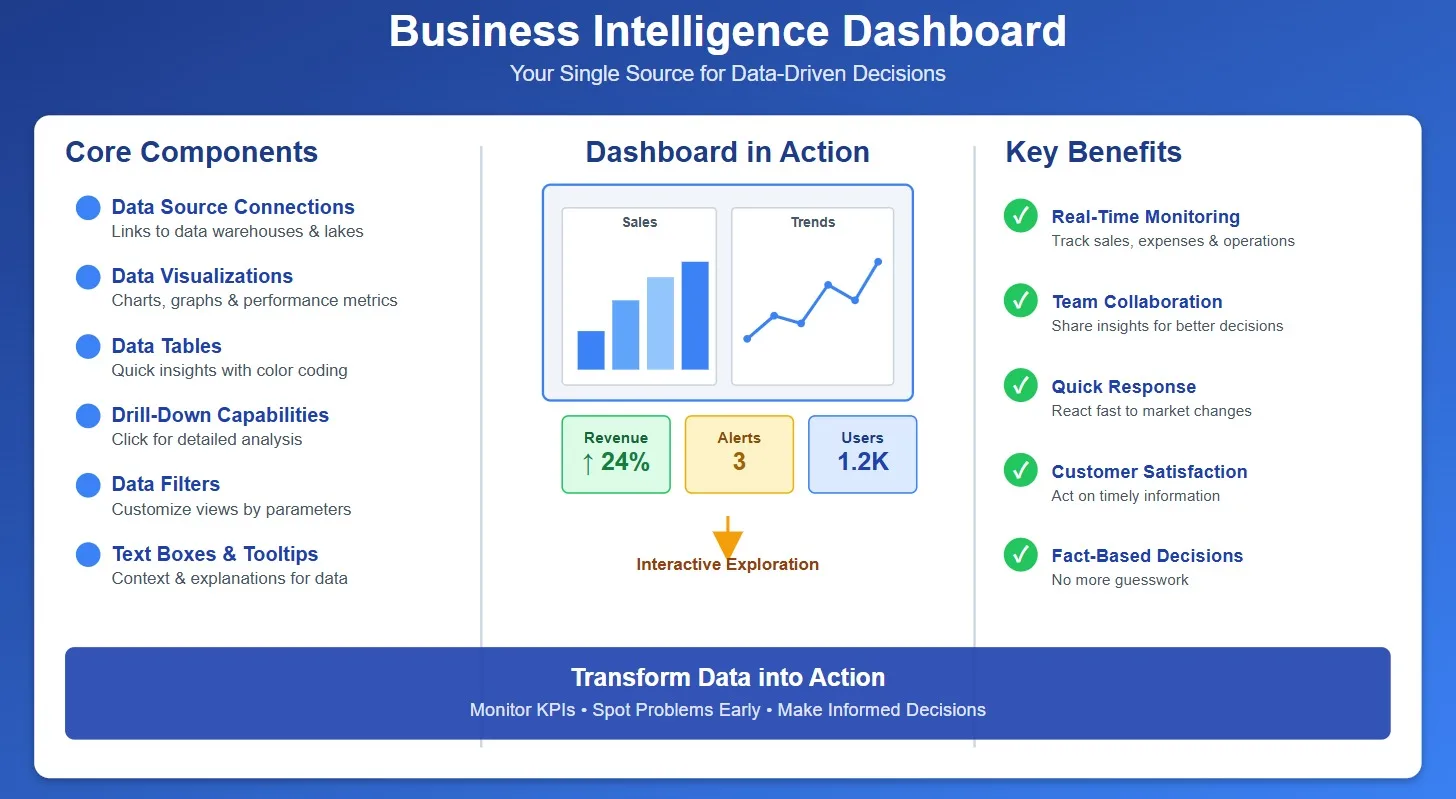
A Business Intelligence Dashboard is an interactive reporting platform that consolidates data from multiple sources into easy-to-understand charts, graphs, and key performance indicators (KPIs). Instead of manually reviewing spreadsheets and reports, users can monitor business performance in real time through a single interface.
BI dashboards enable executives, managers, and sales teams to access critical business information whenever they need it.
Key Features
Real-Time Sales Monitoring
Track daily, weekly, monthly, and yearly sales performance through dynamic charts and interactive reports.
Interactive Dashboards
Filter reports by region, product, salesperson, customer, or time period to gain deeper business insights.
KPI Tracking
Monitor important business metrics, including Total Sales, Revenue, Gross Profit, Sales Growth, Order Volume, Customer Acquisition, Conversion Rate, and Average Order Value. These key indicators provide a clear overview of business performance and help organizations identify areas for improvement.
Data Visualization
Transform complex datasets into professional visualizations using bar charts, pie charts, line graphs, heat maps, and performance scorecards. Interactive visuals make it easier to identify trends, compare results, and communicate insights effectively.
Automated Reporting
Generate scheduled reports automatically, reducing manual work and ensuring stakeholders always have access to the latest business information. Automation improves reporting accuracy while saving valuable time.
Benefits of BI Dashboards
Business Intelligence dashboards provide organizations with numerous advantages. They enable faster decision-making by presenting real-time information in a clear and organized format. Businesses can improve sales forecasting, increase operational efficiency, optimize inventory planning, analyze customer behavior more effectively, monitor employee performance, and develop data-driven strategies for sustainable growth.
By providing accurate and timely information, BI dashboards help organizations respond quickly to changing market conditions and make confident business decisions.
Sales Analytics
Sales analytics plays a critical role in understanding business performance. BI dashboards allow organizations to analyze sales trends across products, regions, customers, and sales representatives.
Sales managers can identify top-performing products, monitor underperforming regions, evaluate team performance, and optimize sales strategies based on real business data. Historical sales data also helps organizations forecast future demand, allocate resources efficiently, and improve overall profitability.
Data Sources
A modern BI dashboard can integrate information from multiple business systems, including ERP systems, CRM platforms, sales databases, Microsoft Excel files, cloud applications, accounting software, inventory management systems, and customer support platforms.
Combining data from different sources creates a single source of truth, allowing every department to make decisions using consistent and reliable information.
Security and Data Governance
Protecting business data is essential. Modern BI dashboards include role-based access control, secure authentication, audit logs, encrypted data transmission, and user permission management to ensure sensitive business information remains protected and accessible only to authorized users.
The Future of Business Intelligence
Artificial Intelligence and Machine Learning are transforming Business Intelligence by introducing predictive analytics, anomaly detection, intelligent forecasting, and automated insights. Instead of simply reporting what has happened, modern BI platforms can predict future trends and recommend actions before problems occur.
As organizations continue to generate increasing volumes of data, AI-powered Business Intelligence solutions will become even more valuable for improving productivity, increasing profitability, and maintaining a competitive advantage.
Conclusion
Business Intelligence dashboards empower organizations to transform raw business data into meaningful insights. By combining real-time reporting, interactive visualizations, sales analytics, and intelligent forecasting, BI solutions enable businesses to make faster, smarter, and more informed decisions.
Whether you're tracking sales performance, monitoring key performance indicators, or planning long-term business strategies, a modern Business Intelligence dashboard is an essential tool for achieving sustainable growth in today's data-driven business environment.